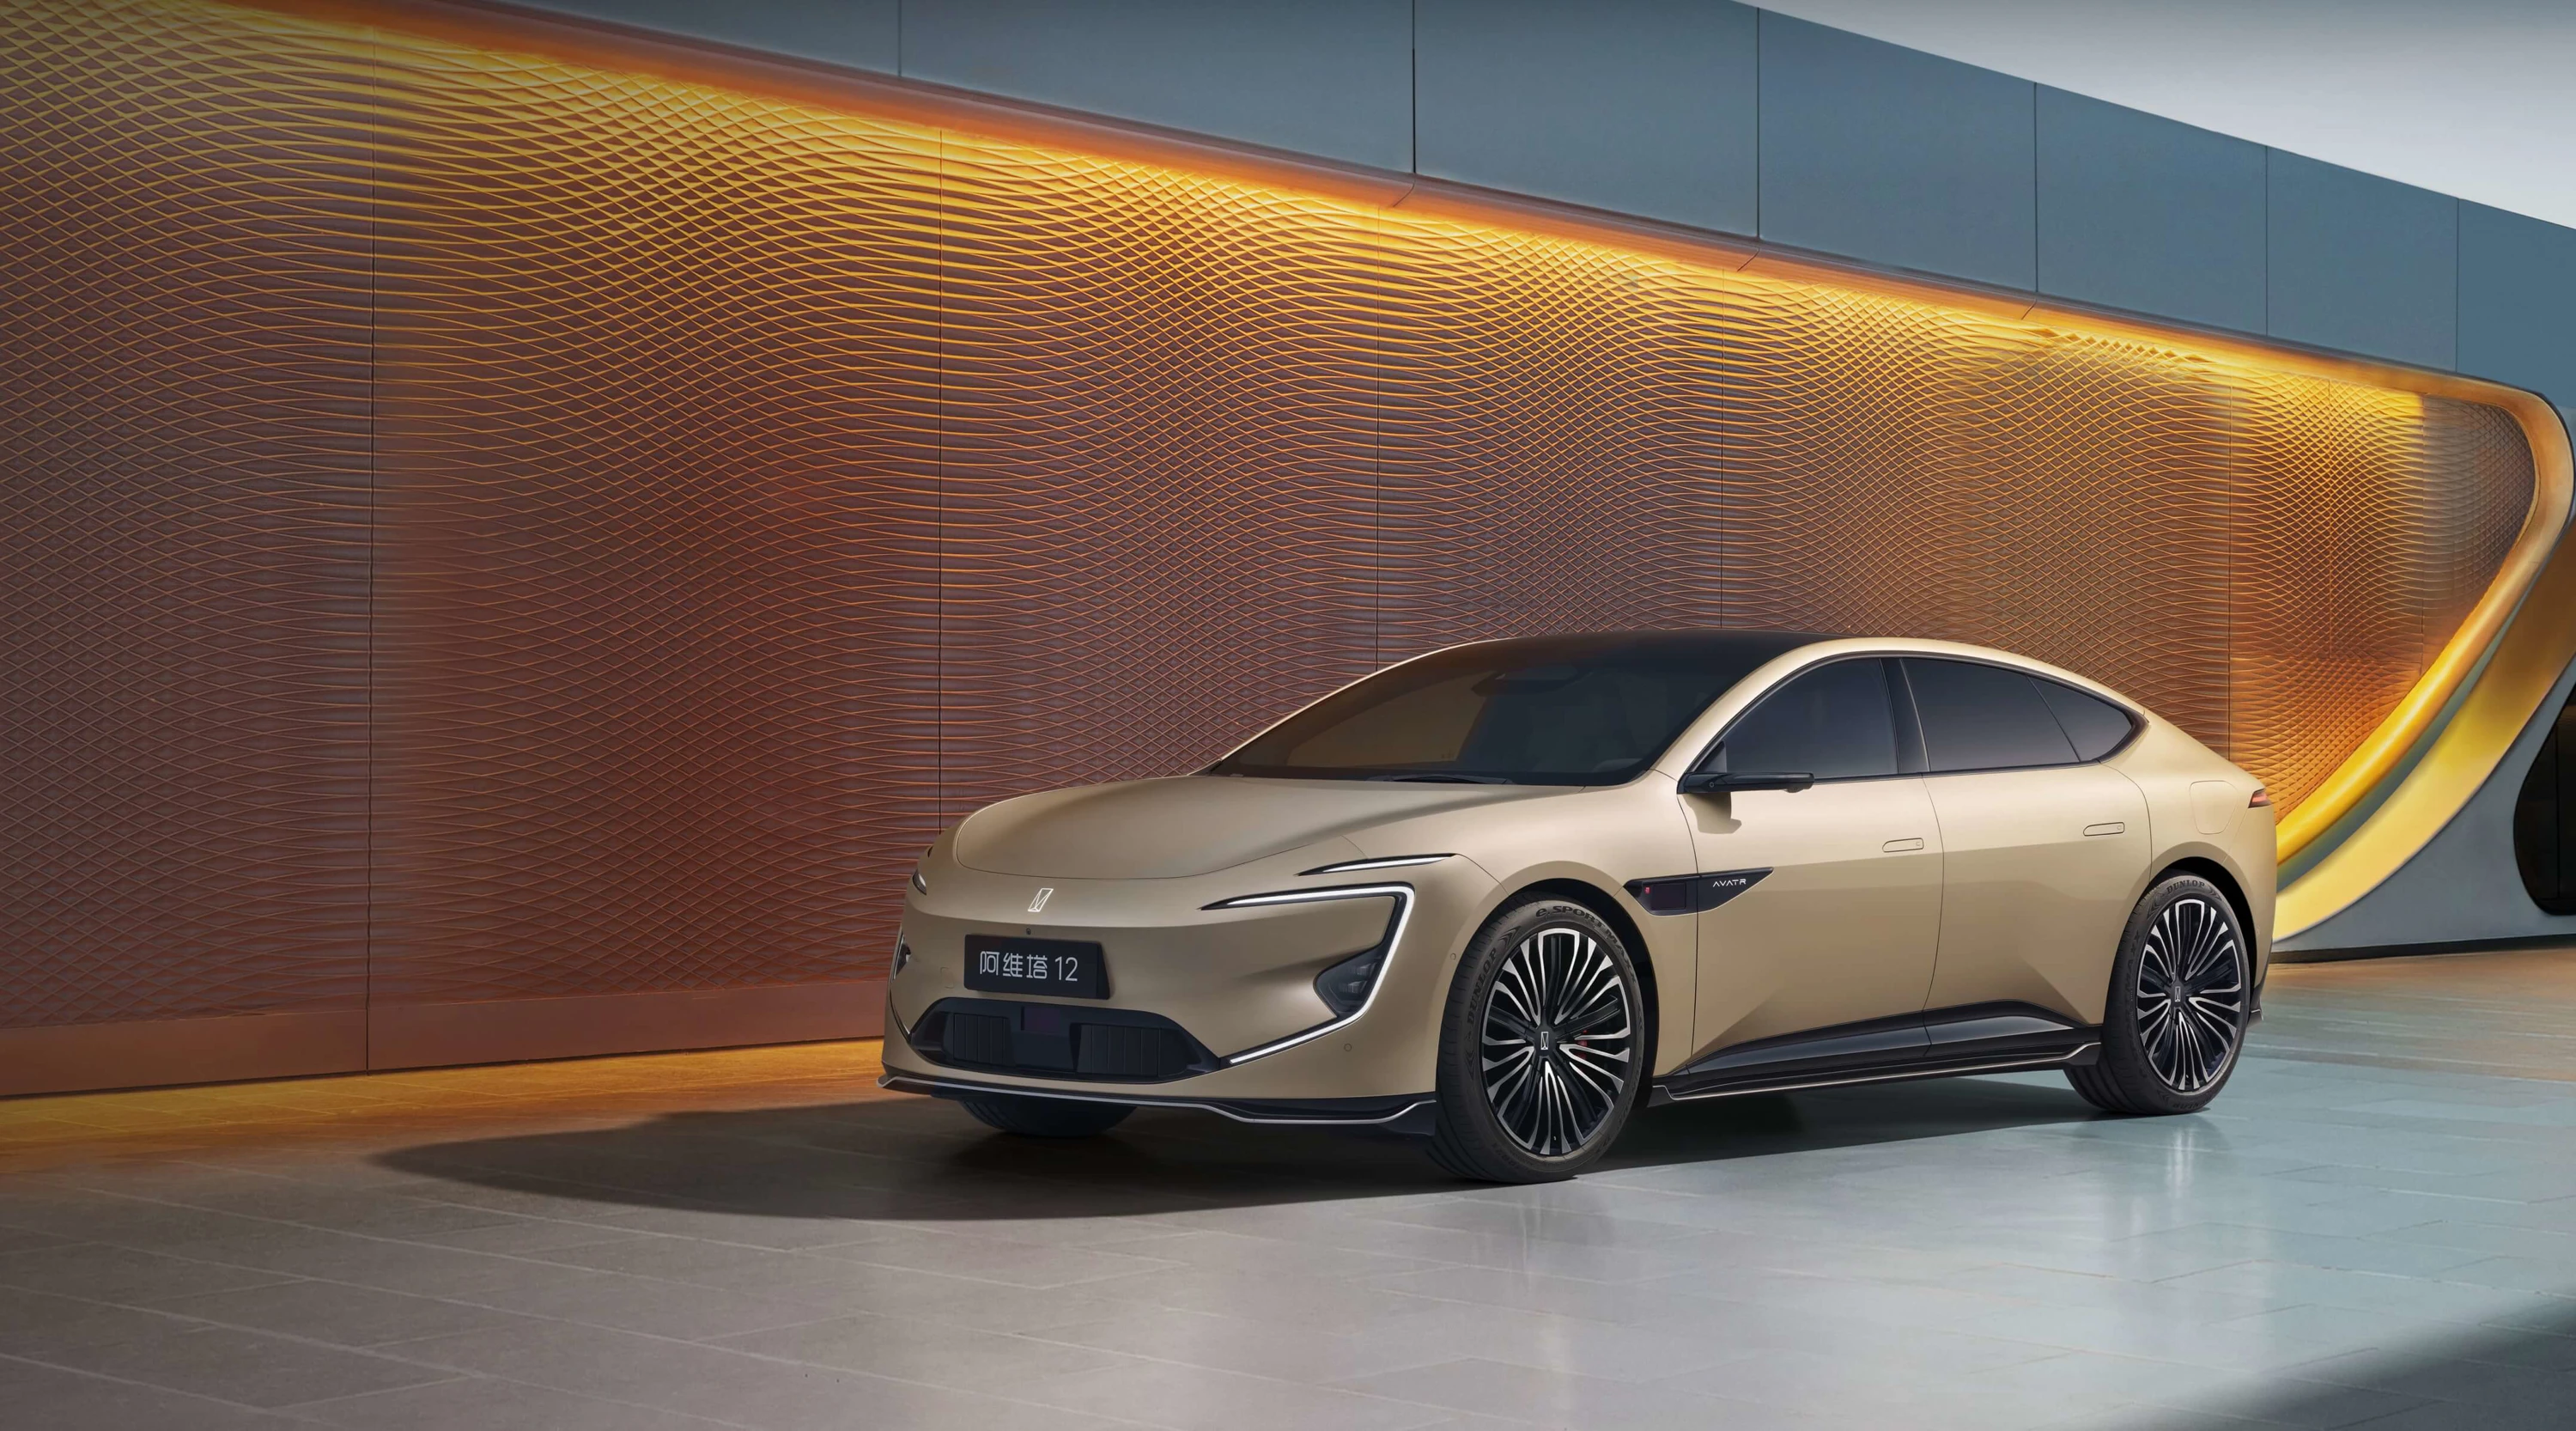
AVATR 12 AWD EV - Electric Vehicle Specs
Power
402 kW
(546 HP)
0-100 km/h
3.8 s
Top Speed
220 km/h
Battery Options
Similar Electric Vehicles
View All Liftbacks →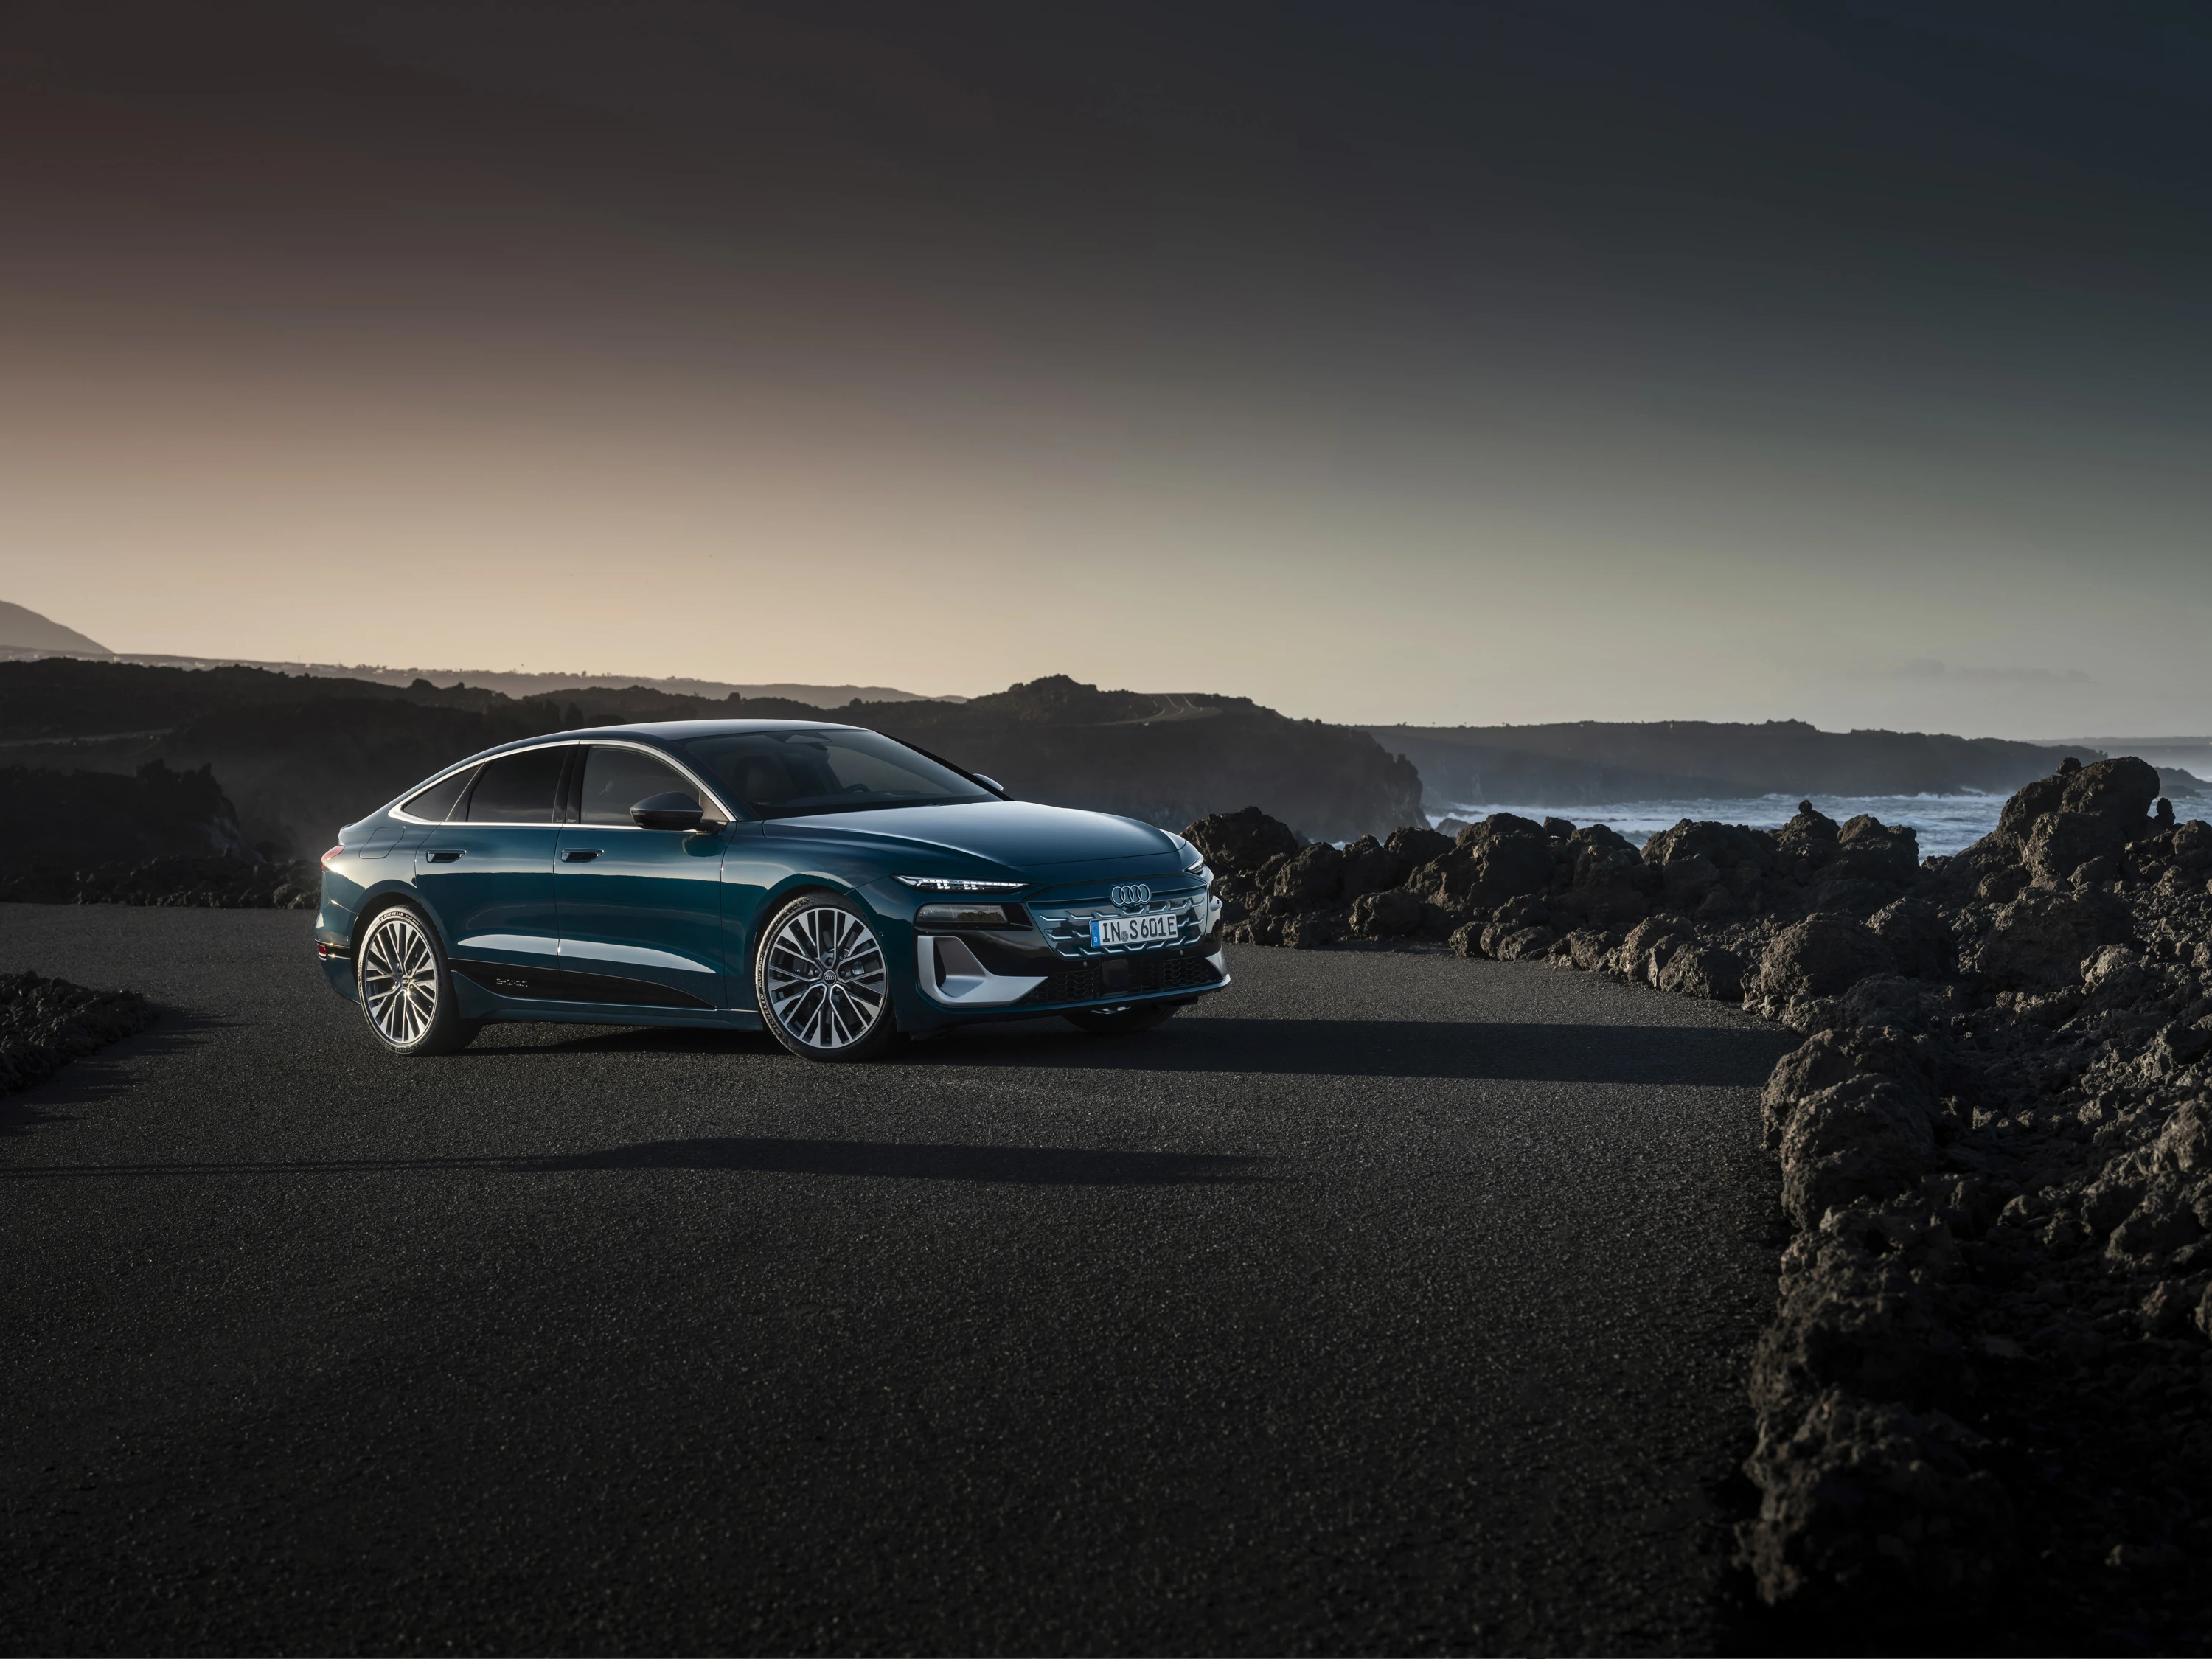
Audi S6 Sportback e-tron
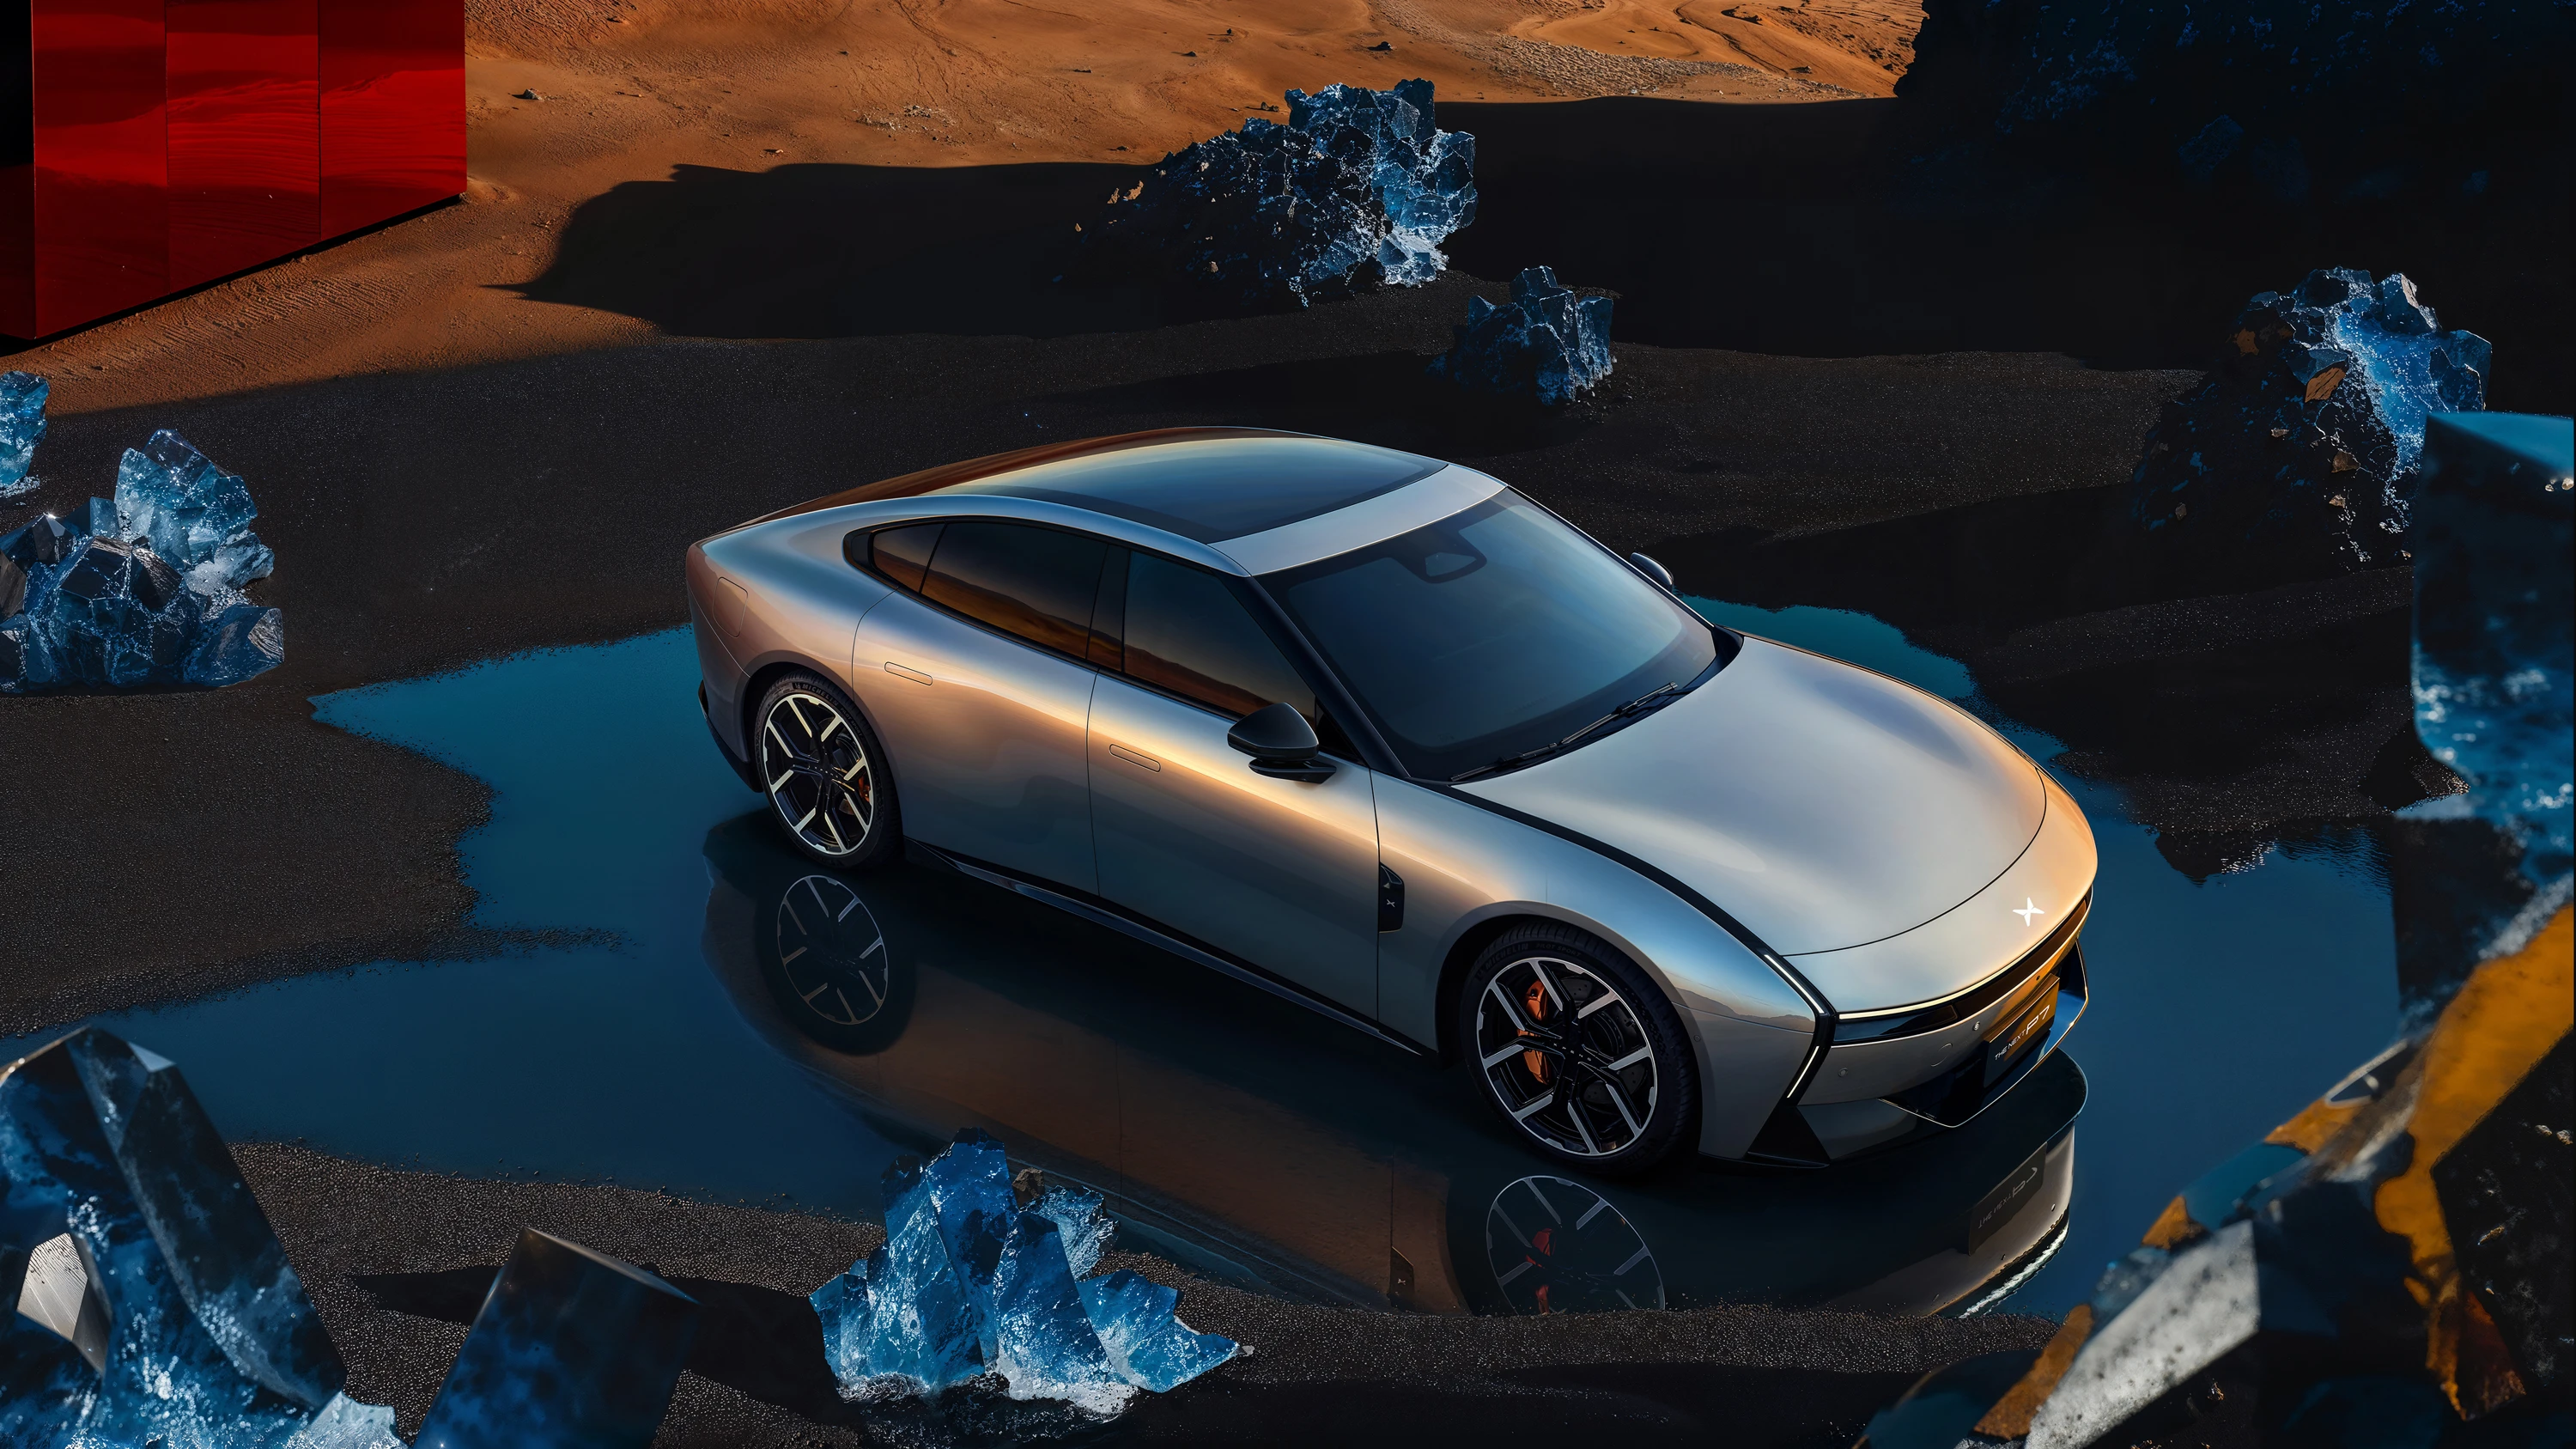
XPENG P7 750 AWD Performance
Charging Curve & Charging Speed Analysis
Understanding Charging Performance
Charging performance isn't just about peak power—it's about sustained power across the entire charging curve. A vehicle that maintains 150kW from 10-80% SOC will charge faster than one that peaks at 250kW but quickly drops to 100kW after 20% SOC. The shape of the curve matters more than the highest peak power.
The key metric is C-rate, which accounts for both charging power and battery capacity. A C-rate of 2.0 means the battery can theoretically charge from 0-100% in 30 minutes, while 1.0 C-rate equals 60 minutes. This makes it easy to compare vehicles regardless of battery size.
Charging Curve Shape
Flat, sustained power across a wide SOC range beats high peaks that quickly taper off. Look for vehicles that maintain high power from 10-80% SOC.
C‑Rate & Timing
C-rate normalizes charging speed across different battery sizes. Higher C-rates mean shorter charging times and more flexible road trip planning.
Battery Options
Average Charging Power
110 kW
Avg C‑rate: 1.2
Maximum Charging Power
229 kW
At 15 → 30% SOC
Minimum Charging Power
10 kW
0–100% Charging Time
54 min
Charging Curve
State of Charge over Time
| SOC Range | Charging Time | Avg. Power | Avg. C-Rate | Energy Added |
|---|---|---|---|---|
| 0% → 100% | 54 min | 109.7 kW | 1.19 C | 98.9 kWh |
| 0% → 90% | 38 min | 139.4 kW | 1.51 C | 89.0 kWh |
| 0% → 80% | 31 min | 148.9 kW | 1.62 C | 79.1 kWh |
| 5% → 100% | 50 min | 112.0 kW | 1.22 C | 94.0 kWh |
| 5% → 90% | 34 min | 146.1 kW | 1.59 C | 84.1 kWh |
| 5% → 80% | 28 min | 158.4 kW | 1.72 C | 74.2 kWh |
| 10% → 100% | 48 min | 110.6 kW | 1.20 C | 89.0 kWh |
| 10% → 90% | 32 min | 146.1 kW | 1.59 C | 79.1 kWh |
| 10% → 80% | 26 min | 159.3 kW | 1.73 C | 69.2 kWh |